You may have seen a previous post of mine about VMSS scaling based on RabbitMQ queue size using logic apps. If not you can read about it at https://pixelrobots.co.uk/2019/09/scale-an-azure-vmss-based-on-rabbitmq-queue-size-using-an-azure-logic-app/. Well I have been thinking wouldn’t it be good to get the queue size, amount of messages and the VMSS node count to be in log analytics so I can make some dashboards or query the data.
This post will show you how to do that.
Let’s get to it
You will need a logic app. I am going to use my VMSS scale one from the blog post I mentioned above.
Once you have that, at the bottom of the logic app click on the + New step button. And then search for send data.
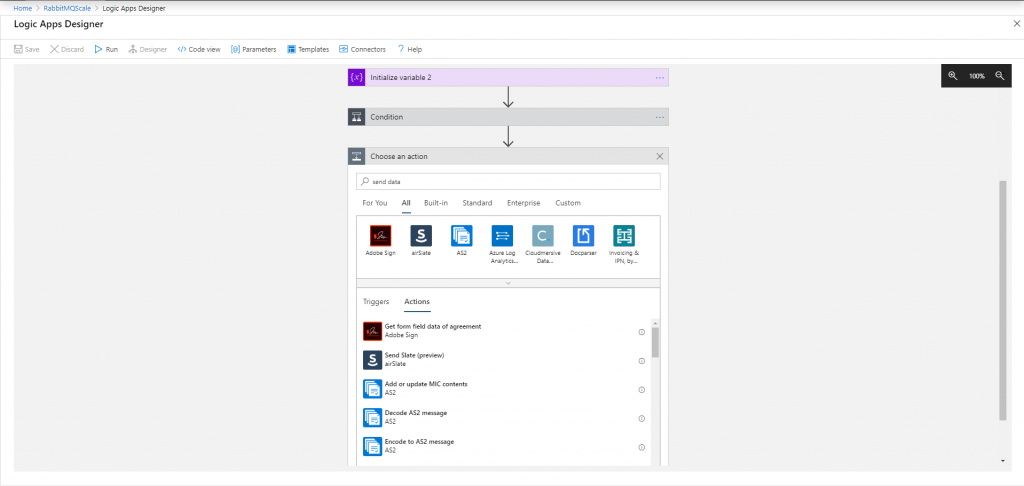
Then click on the Azure Log Analytics… Button. You will now see Send Data (preview) if you don’t make sure you click Actions.

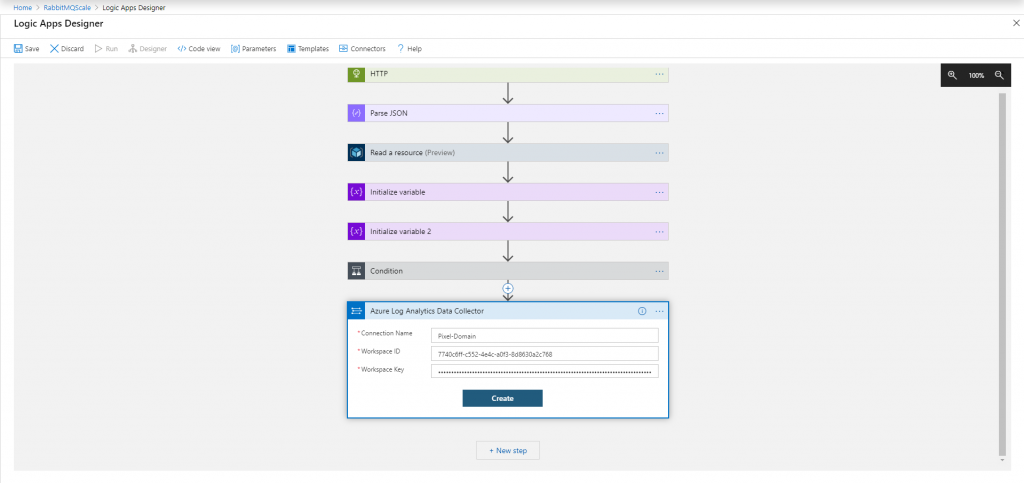
In here you will need to fill in 3 boxes. The first one, Connection Name, can be anything to help you remember what log analytics workspace this connects to.
The second and third box needs data that can be found from within your workspace. So, first, navigate to the workspace you want to send the logs to. In there click on Advanced Settings on the left.

In the Advanced settings blade, you will see your Workspace ID. Copy this and past it in box two on your logic app.
Then copy the Primary Key make sure to get it all as its longer than the box and paste it into the third box back on the logic app blade.
Then click Create.
You will now have 3 new boxes that can be filled in. You only need to fill in the first two.
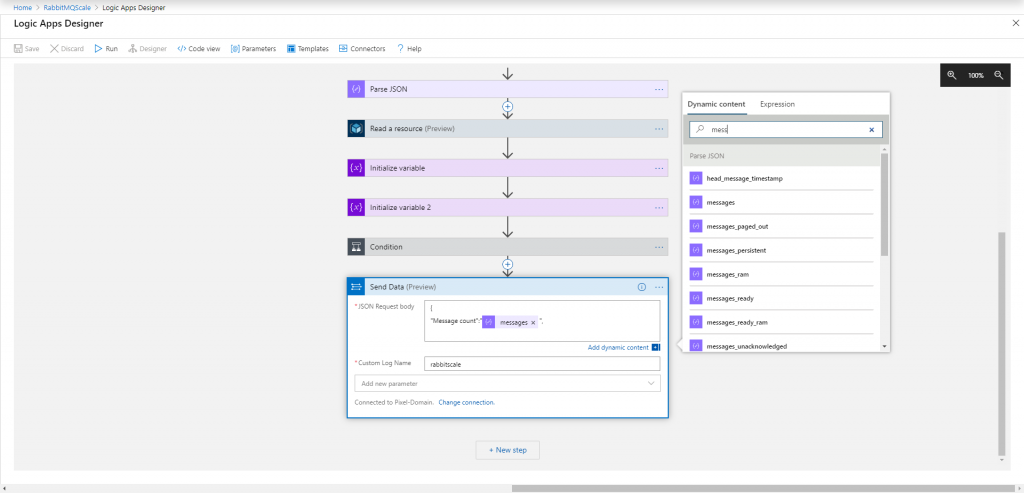
In the first box JSON Request body, you will need to enter some JSON. This is what is going to end up in your log analytics workspace.
So, for me I am going to start by typing:
{
"Message count":"Code language: JSON / JSON with Comments (json)
I will then use the dynamic content box to search for messages. I will then click that and close it off with another ” and a ,
You will see in the picture what I mean.
I will then repeat this but for the consumers.
Once you have finished your JSON move to the next box.
This box will become the name of the table in your log analytics workspace. Enter something that suits your needs and then click Save at the top.

Now just wait for the logic app to run a few times and then go and have a look at your log analytics workspace. In here if you expand Custom Logs you will see your new Log name.
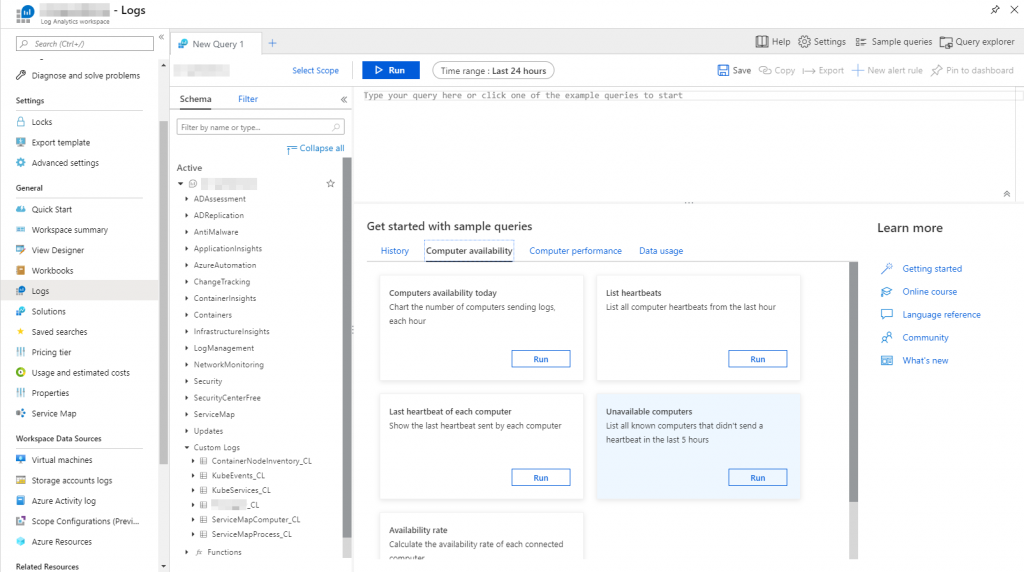
You will see that the name of your log has _CL at the end. This is to be expected.
You can now do a basic query to see what you have captured.
rabbitscale_CL
| project Messages_in_Queue_s , Consumers_s 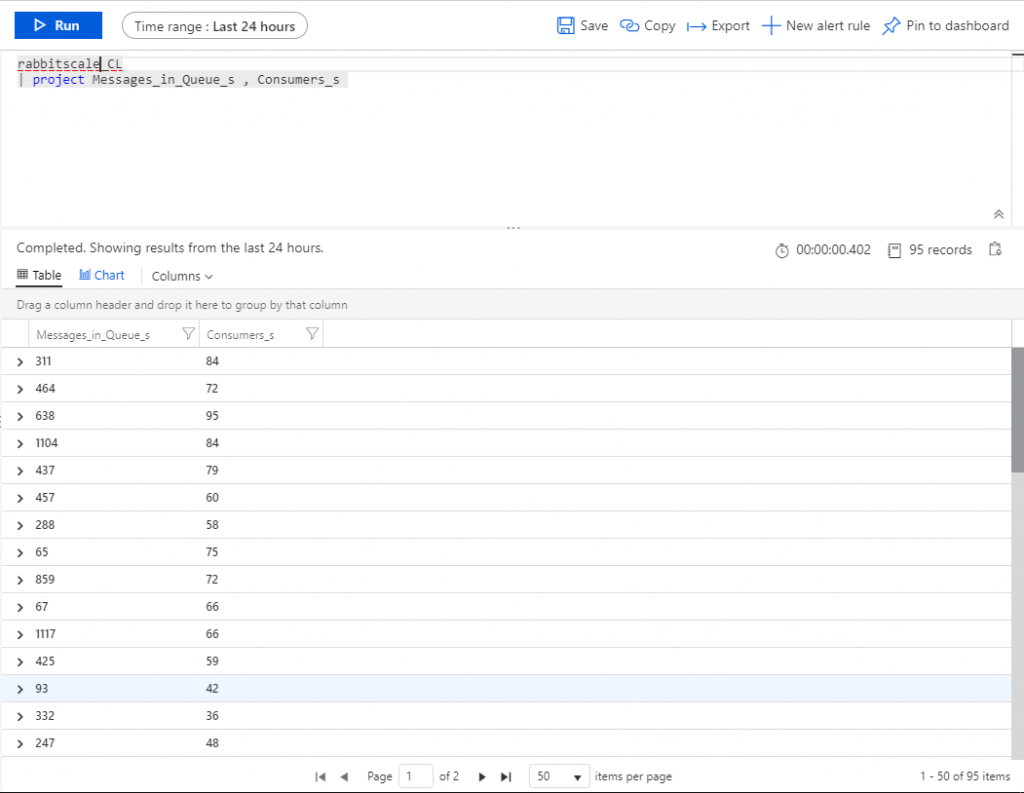
Now you can go off and create any query you would like and pin it to a dashboard.
I mentioned in the first part of this blog how you could add the node count from the VMSS but i have not shown you. Well to do that you will need to create a variable first. You can see how to do that from my previous blog post. Then you just need to add the variable into the JSON request body.
I hope you found this article helpful. If you have any questions please reach out.
2 Comments
jason copsey · March 1, 2023 at 12:37 pm
thanks for this, was messing around trying to build the auth header in Logic App variables. This saved me a tonne of time.
Anurag · January 29, 2024 at 12:41 am
Nice article able creating log analytics table and filling data, I am worried if I am using endpoint to fetch data and later I push into table then how would I be able to stop processing duplicate data