At work
With the B-Series VMs, you earn credits to allow you to burst when the VM is running below its base performance level. So in my case less than 90%. You then use the credits when the server needs to burst. In my case, I had
Below I am going to show you how to monitor the remaining credits using Azure Monitor and then pin the graph to an Azure Dashboard all using the Azure Portal.
Lets get to it!
Prerequisites
- A list of all your B-Series VMs and what resource group they are in.
- A Dashboard Created and selected (opened). This Dashboard will be the one the graph is pinned to.
Configuration time
Open up the Azure Portal and navigate to Monitor.

In the Monitor blade click on Metrics.

In this blade

Click on the Subscription drop down if you need to change Subscription. Then click on Resource group. Here you can start to type the resource group that your B-Series VM resides in. Once found put a tick in the box.

Now you will have a list of resources that reside in the selected resource group. Find the burstable VM and click it.

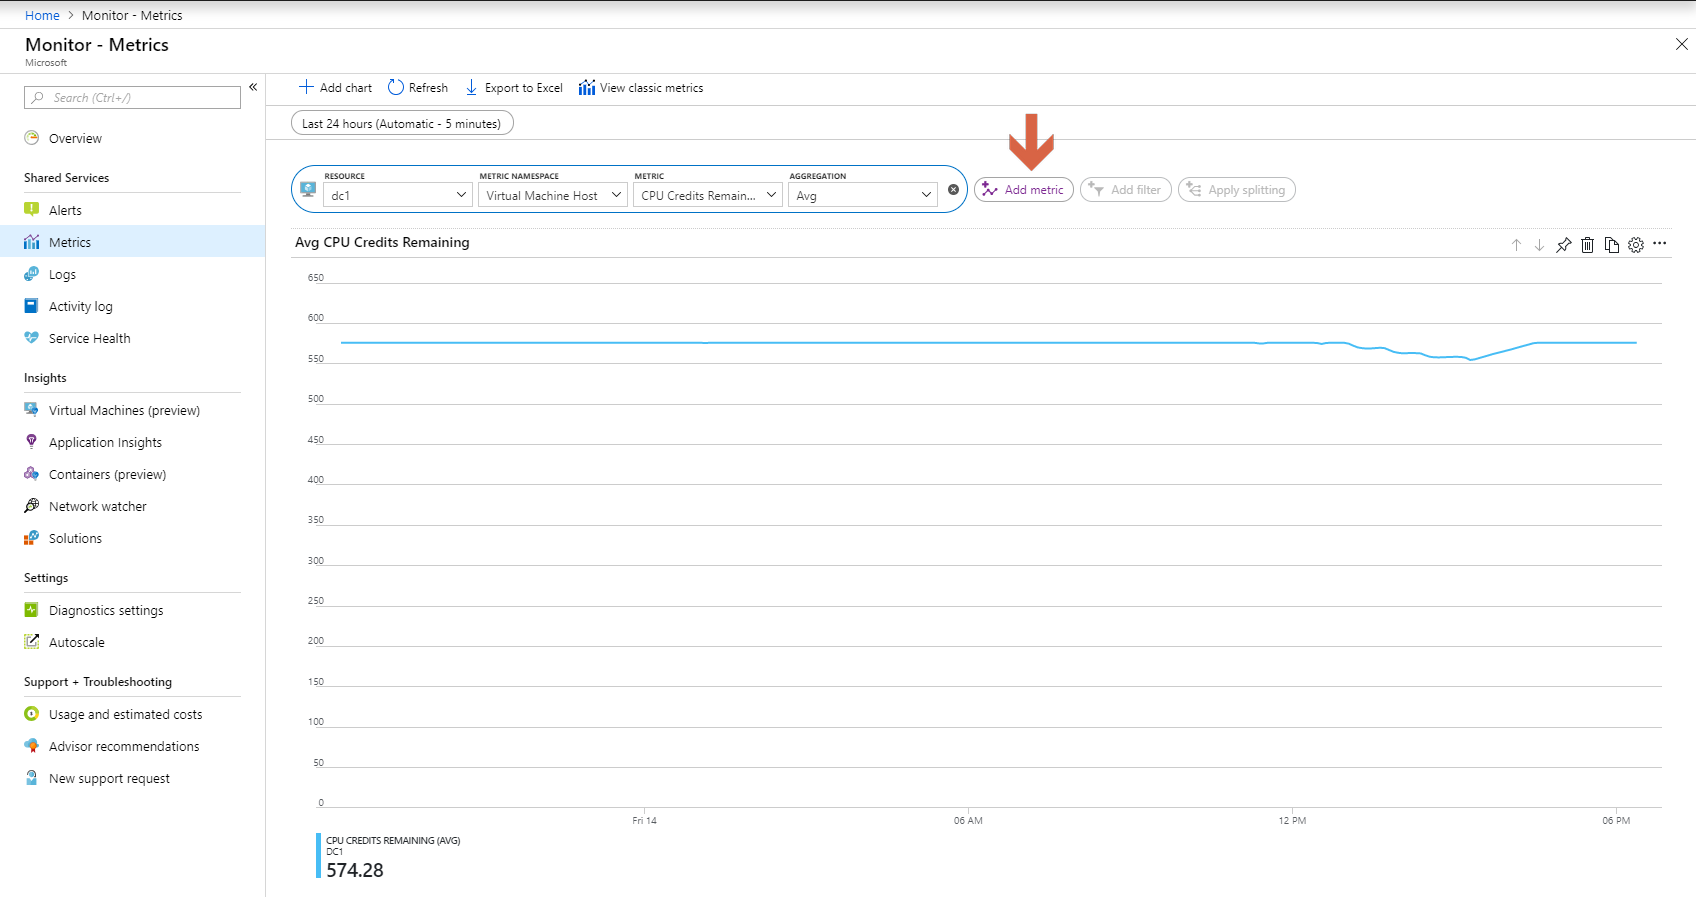
Next, we have to select the metric we want to measure. You do this by clicking Metric and then select CPU Credits Remaining. You could also select CPU Credits Consumed. This metric will show you how many credits your VM has consumed.

You should now have a nice line showing you how many credits the VM has remaining. To add more VMs to this chart you have to click the Add metric button and then repeat the steps above.

Once you have all of your VMs added to the chart you can then pin it to an Azure Dashboard.
Pinning to a Dashboard
This bit actually really easy. You may have

Here you can click on the Custom button and then type the name you would like to use.

Click the X to save the changes and then click the Pin to pin it to your Dashboard.

A purple bar will appear at the top of the Azure portal. Click the button to view the Dashboard.

Move your chart around till you are happy and then save it.
That’s all there is to it. You now have a nice chart showing you at a glance how many credits you Azure B-Series VMs have left. You can also create alerts when the credits are running low. I may do another article on how to set this up, but you may be able to work it out easy. Hint, you use Alerts in the Monitor blade.
I hope you found this article helpful, if you have any questions or comments please reach out using the usual methods.
1 Comment
Sylvain · November 6, 2020 at 4:56 pm
interesting but what is the difference of aggregation for the credit consummed/remaining : Min, Avg, Sum, Max, Sum
I’m not really sure which one to choose 🙂